Author

admin

Browsing

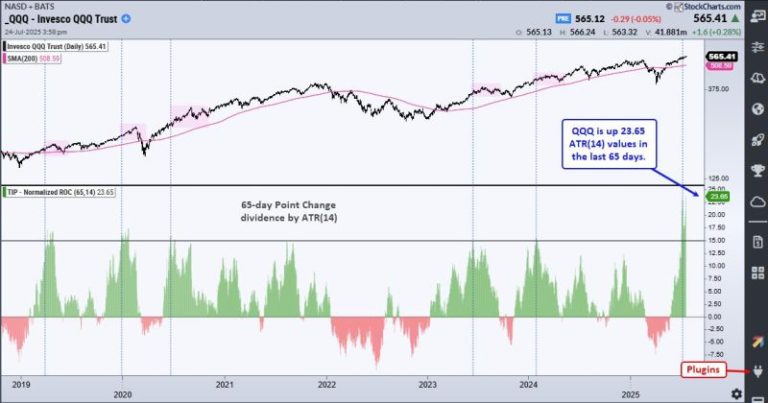
Here are some charts that reflect our areas of focus this week at


XLU Leads with New High

Even though the Utilities SPDR (XLU) cannot keep pace with the Technology SPDR (XLK) and Communication Services SPDR (XLC), it is in a leading uptrend. XLU formed a cup-with-handle from November to July and broke to new highs the last two weeks. ETFs hitting new highs are in strong uptrends and should be on our radar.


Metal Mania in 2025

In a tribute to Ozzy, metals are leading the way higher in 2025. The PerfChart below shows year-to-date performance for the continuous futures for 12 commodities. Copper, Platinum and Palladium are up more than 45% year-to-date, while Gold is up 28.38% and Silver is up 35.30%. QQQ is up 10.52% year-to-date, but lagging these metals. The other commodities are mixed.


Multi-Year Highs for Silver and Copper

The next chart shows 11 year bar charts for five metals. Gold broke out in early 2024 and led the metals move with an advance the last 21 months. Silver and copper broke out to multi-year highs. Platinum broke above its 2021 high and Palladium got in the action with an 18 month high. There is a clear message here: metals are moving higher and leading as a group.  


Home Construction Hits Moment of Truth

The Home Construction ETF (ITB) hit its moment of truth as it rose to its falling 40-week SMA. Notice that ITB failed just below this moving average in August 2023. During the 2023-2024 uptrend, the 40-week SMA was more friendly as ITB reversed near this level in October 2023 and June 2024. ITB surged to the falling 40-week SMA in July, but the long-term trend is down and this area could be its nemesis.

Thanks for Tuning in!

See TrendInvestorPro.com for more


The S&P 500 ($SPX) just logged its fifth straight trading box breakout, which means that, of the five trading ranges the index has experienced since the April lows, all have been resolved to the upside.

How much longer can this last? That’s been the biggest question since the massive April 9 rally. Instead of assuming the market is due to roll over, it’s been more productive to track price action and watch for potential changes along the way. So far, drawdowns have been minimal, and breakouts keep occurring. Nothing in the price action hints at a lasting change — yet.

While some are calling this rally “historic,” we have a recent precedent. Recall that from late 2023 through early 2024, the index had a strong start and gave way to a consistent, steady trend.

From late October 2023 through March 2024, the S&P 500 logged seven consecutive trading box breakouts. That streak finally paused with a pullback from late March to early April, which, as we now know, was only a temporary hiccup. Once the bid returned, the S&P 500 went right back to carving new boxes and climbing higher.

New 52-Week Highs Finally Picking Up

If there’s been one gripe about this rally, it’s that the number of new highs within the index has lagged. As we’ve discussed before, among all the internal breadth indicators available, new highs almost always lag — that’s normal. What we really want to see is whether the number of new highs begins to exceed prior peaks as the market continues to rise, which it has, as shown by the blue line in the chart below.

As of Wednesday’s close, 100 S&P 500 stocks were either at new 52-week highs or within 3% of them. That’s a strong base. We expect this number to continue rising as the market climbs, especially if positive earnings reactions persist across sectors.

Even when we get that first day with 100+ S&P 500 stocks making new 52-week highs, though, it might not be the best time to initiate new longs.

The above chart shows that much needs to align for that many stocks to peak in unison, which has historically led to at least a short-term consolidation, if not deeper pullbacks — as highlighted in yellow. Every time is different, of course, but this is something to keep an eye on in the coming weeks.

Trend Check: GoNoGo Still “Go”

The GoNoGo Trend remains in bullish mode, with the recent countertrend signals having yet to trigger a greater pullback.

Active Bullish Patterns

We still have two live bullish upside targets of 6,555 and 6,745, which could be with us for a while going forward. For the S&P 500 to get there, it will need to form new, smaller versions of the trading boxes.

Failed Bearish Patterns

In the chart below, you can view a rising wedge pattern on the recent price action, the third since April. The prior two wedges broke down briefly and did not lead to a major downturn. The largest pullbacks in each case occurred after the S&P 500 dipped below the lower trendline of the pattern.

The deepest drawdown so far is 3.5%, which is not exactly a game-changer. Without downside follow-through, a classic bearish pattern simply can’t be formed, let alone be broken down from.

We’ll continue to monitor these formations as they develop because, at some point, that will change.

Is the market’s next surge already underway? Find out with Tom Bowley’s breakdown of where the money is flowing now and how you can get in front of it.

In this video, Tom covers key moves in the major indexes, revealing strength in transports, small caps, and home construction. He identifies industry rotation signals, which are pointing to aluminum, recreational products, and furnishings. Tom then demonstrates how to use StockCharts’ tools to scan for momentum stocks in emerging leadership groups — see why SGI tops Tom’s list. He ends with a discussion of post-earnings reactions from major names like GOOGL, TSLA, IBM, and LVS. 

And, of course, Tom wraps every idea with clear chart setups you can act on today. 

This video premiered on July 24, 2025. Click this link to watch on Tom’s dedicated page.

Missed a session? Archived videos from Tom are available at this link.

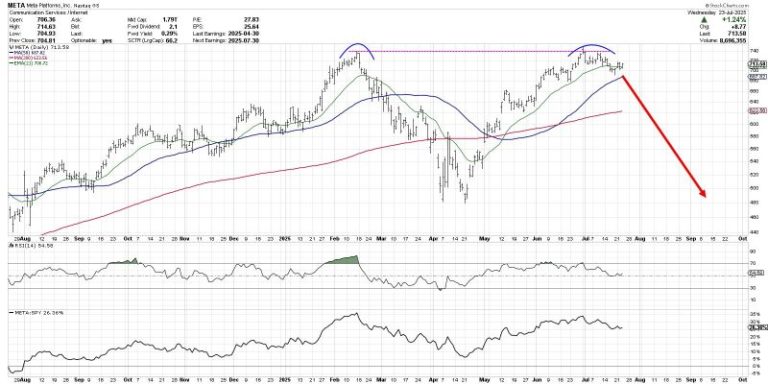
The chart of Meta Platforms, Inc. (META) has completed a roundtrip from the February high around $740 to the April low at $480 and all the way back again.  Over the last couple weeks, META has now pulled back from its retest of all-time highs, leaving investors to wonder what may come next.

Is this the beginning of a new downtrend phase for META?  Or just a brief pullback before a new uptrend phase propels META to new all-time highs?

Today we’ll look at two potential scenarios, including the double top pattern and the cup and handle pattern, and share which technical indicators and approaches could help us determine which path plays out into August.

The double top scenario basically means that the late July retest of the previous all-time high was the end of the recent uptrend phase.  The double top pattern is literally when a major resistance level is set and then retested.  The implication is that a lack of willing buyers means the uptrend is exhausted, and there is nowhere to go but down.

While the 21-day exponential moving average is currently in play for META, I would say that a break below the 50-day moving average could confirm this as the correct scenario.  If that smoothing mechanism does not hold, then the price action would imply less of a pullback and more like the beginning of a real distribution phase.

What is META pulls back but then resumes an uptrend phase, leading META to another new all-time high?  That would result in a confirmed cup and handle pattern, created by a large rounded bottoming pattern followed by a brief pullback.  The key to this pattern is the “rim” of the cup, which sits right at $740 for META.

Given the pullback META has demonstrated so far in July, I would say that a break above the $740 level would basically confirm a bullish cup and handle pattern.  That would suggest much more upside potential for META, as the stock would literally go into previously uncharted territory.

So how can we determine which scenario is more likely to play out?  This is where we need to incorporate more technical indicators into the discussion, as a way to further validate and confirm our investment thesis.

Just to review, I think a break above $740 would confirm a bullish cup and handle pattern.  I would also say that a break below the $680 level, which would represent a move below the 50-day moving average as well as the June swing lows, would basically confirm a bearish double top pattern.

We can also use the Relative Strength Index (RSI) to help determine whether META remains in a bullish trend phase.  During bull phases, the RSI rarely gets below 40, because buyers usually step in to “buy the dips” and keep the momentum fairly constructive.  So if the price would break down, and the RSI would not hold that crucial 40 level, that could mean a bearish outlook is warranted.

Finally, we can use volume-based indicators to assess whether moves in the price are supported by stronger volume readings.  Here I’ve included the Accumulation/Distribution Line, which tracks the trend in daily volume readings over time.  We can see that the high in July resulted in a divergence, as the A/D line was trending lower.  If the A/D line would break below its June and July lows, marked by a dashed red line, that would represent a bearish volume reading for META.

Technical analysis is less about predicting the future, and more about determining the most probable scenarios based on our analysis of trend, momentum, and volume.  I hope this discussion shows how the outlook for META can be easily determined and tracked using the best practices of technical analysis!

RR#6,

Dave

PS- Ready to upgrade your investment process?  Check out my free behavioral investing course!

David Keller, CMT

President and Chief Strategist

Sierra Alpha Research LLC

marketmisbehavior.com

https://www.youtube.com/c/MarketMisbehavior

Disclaimer: This blog is for educational purposes only and should not be construed as financial advice.  The ideas and strategies should never be used without first assessing your own personal and financial situation, or without consulting a financial professional.  

The author does not have a position in mentioned securities at the time of publication.    Any opinions expressed herein are solely those of the author and do not in any way represent the views or opinions of any other person or entity.

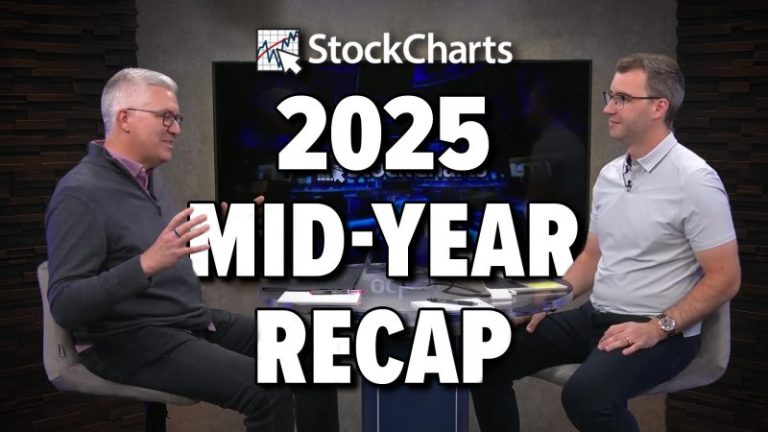
Markets don’t usually hit record highs, risk falling into bearish territory, and spring back to new highs within six months. But that’s what happened in 2025.

In this special mid-year recap, Grayson Roze sits down with David Keller, CMT, to show how disciplined routines, price-based signals, and a calm process helped them ride the whipsaw instead of getting tossed by it. You’ll see what really happened under the surface, how investor psychology drove the swings, and the exact StockCharts tools they leaned on to stay objective. 

If you’re focused on protecting capital, generating income, and sleeping well at night while still capturing the upside, this is a must-watch. Discover which charts deserve your attention now, what to ignore, and how to prep for the back half of 2025. 

This video premiered on July 23, 2025. Click on the above image to watch on our dedicated Grayson Roze page on StockCharts TV.

You can view previously recorded videos from Grayson at this link.

(TheNewswire)

September 15, 2025 TheNewswire – Vancouver, British Columbia Blue Lagoon Resources Inc. (‘Blue Lagoon’ or the ‘Company’) (CSE: BLLG,OTC:BLAGF; OTCQB: BLAGF; FSE: 7BL) is pleased to announce that the Moving Bed Biofilm Reactor (‘MBBR’) system at its Dome Mountain Water Treatment Plant is now ready for commissioning.

Designed to meet all regulatory discharge standards, the plant was developed in close collaboration with Soren Jensen, the Company’s principal environmental consultant from SRK Consulting. Mr. Jensen, who holds a masters degree in chemical engineering, has more than 20 years of experience designing, commissioning, and operating mine water treatment systems, including similar facilities at underground gold mines in Northern Canada. His expertise ensures that the Dome Mountain system is engineered to treat mine water efficiently, in full compliance with permit conditions, and in alignment with Blue Lagoon’s commitment to environmental stewardship.

The MBBR system is part of Dome Mountain’s state-of-the-art Water Treatment Plant, which is designed to treat up to 400 liters per minute (‘L/min’). Current mine water output is approximately 20-40 L/min, ensuring ample capacity as operations scale. This robust infrastructure underscores Blue Lagoon’s commitment to environmental stewardship while supporting safe and efficient underground development.

MINING TO COMMENCE SEPTEMBER 24, 2025

Underground mining operations are scheduled to commence on September 24, 2025 , beginning with development work. The Company expects to achieve a steady ramp-up to 100 tonnes per day (‘tpd’) within four weeks and 150 tpd within twelve weeks. By that point the Company expects to have five to six working faces exposed, providing strong operational flexibility. Importantly, all mine waste will remain underground, further aligning with the Company’s environmental and regulatory commitments.

To enhance operational readiness and safety, Blue Lagoon has signed a Mutual Aid Agreement with New Gold Inc. , reinforcing its collaborative approach and ensuring rapid access to additional emergency support if ever required.

The Company’s underground program will be led by Mike McCartin , a seasoned underground mining geologist who will oversee daily operations and training of mine staff. Complementing this, a Senior Mining Engineer from Roughstock Mining Services will establish mining protocols, standard operating procedures (SOPs), and underground surveying requirements, ensuring industry best practices are embedded from day one.

‘As we commission the MBBR system and prepare to send our crews underground to commence operations, Blue Lagoon is entering a transformational phase,’ said Rana Vig, President & CEO of Blue Lagoon Resources. ‘With a fully permitted project, the right infrastructure, and a strong technical team, we are well positioned to generate near-term cash flow, while minimizing risk and maximizing efficiency. Dome Mountain is rare in British Columbia, one of only nine projects permitted since 2015, and we are proud to be advancing it responsibly, with safety and environmental care at the forefront.’

About Blue Lagoon Resources Inc.

Blue Lagoon Resources is a Canadian based publicly listed mining company (CSE: BLLG,OTC:BLAGF; FSE: 7BL; OTCQB: BLAGF) focused on building shareholder value through the aggressive development of its 100% owned Dome Mountain Gold project. The Company is run by professionals with significant finance and mining experience and operates within a prime mining jurisdiction in British Columbia, Canada. With the granting of a full mining permit, a key milestone achieved in February 2025 – one of only nine such permits issued in British Columbia since 2015 – Blue Lagoon is now focused on last preparatory activities and tasks related to the safe and secure opening of the Dome Mountain Gold Mine, targeting Q3 2025 as the start of gold production . The Company’s primary objective has always been to become a cash-flowing mining company, to ultimately deliver tangible monetary value to shareholders, state, and local communities.

The Company is not basing its production decision at Dome Mountain on a feasibility study of mineral reserves demonstrating economic and technical viability. The production decision is based on having existing mining infrastructure, past bulk sampling and processing activity, and the established mineral resource.  The Company understands that there is increased uncertainty, and consequently a higher risk of failure, when production is undertaken in advance of a feasibility study.

For further information, please contact:

Rana Vig

President and CEO

Telephone: 604-218-4766

Email: ranavig@bluelagoonresources.com

The CSE has not reviewed and does not accept responsibility for the adequacy or accuracy of this release.

Statement Regarding Forward-Looking Information: This release includes certain statements that may be deemed ‘forward-looking statements’. All statements in this release, other than statements of historical facts, that address events or developments that Blue Lagoon Resources Inc. (the ‘Company’) expects to occur, are forward-looking statements. Forward-looking statements are statements that are not historical facts and are generally, but not always, identified by the words ‘expects’, ‘targets’, ‘plans’, ‘anticipates’, ‘believes’, ‘intends’, ‘estimates’, ‘projects’, ‘potential’, ‘mine’, ‘production’ and similar expressions, or that events or conditions ‘will’, ‘would’, ‘may’, ‘could’ or ‘should’ occur. Although the Company believes the expectations expressed in such forward-looking statements are based on reasonable assumptions, such statements are not guarantees of future performance and actual results may differ materially from those in the forward-looking statements. Factors that could cause the actual results to differ materially from those in forward-looking statements include results of exploration activities may not show quality and quantity necessary for further exploration or future exploitation of minerals deposits, volatility of gold and silver prices, delays in mine development activities, future cash flow expectations and continued availability of capital and financing, permitting and other approvals, and general economic, market or business conditions.  Investors are cautioned that any such statements are not guarantees of future performance and actual results or developments may differ materially from those projected in the forward-looking statements. Forward-looking statements are based on the beliefs, estimates and opinions of the Company’s management, contractors and consultants on the date the statements are made. Except as required by applicable securities laws, the Company undertakes no obligation to update these forward-looking statements in the event that management’s, contractor’s and consultants’ beliefs, estimates or opinions, or other factors, should change.

Copyright (c) 2025 TheNewswire – All rights reserved.

News Provided by TheNewsWire via QuoteMedia

This post appeared first on investingnews.com

VVC Exploration Corporation, dba VVC Resources, (‘VVC’), (TSX-V:VVC and OTCQC:VVCVF) announces the following events.

Loan from Chairman

VVC’s Chairman of the Board, Terrence Martell Ph.D. (the ‘Lender’), has provided a US$700,000 loan (the ‘Loan’) to VVC’s subsidiary, Plateau Helium Corp., for use in operating and developing its Helium/PNG assets in Kansas, USA. The Loan, secured by a Promissory Note, is payable on demand and bears no interest. The Loan contains a conversion option whereby, at the sole option and discretion of the Lender, all or any portion of the outstanding principal amount can be settled with up to 230,000 shares of Cyber App Solutions (CRYB) at a price of US$3.09 per share.

Director Resignation

Mr. Steven Looper has resigned as a director of the Company for personal reasons and his resignation was accepted by the Board with regret. VVC would like to thank Mr. Looper, who served the Company as director since September 2023. Jim Cuver, VVC CEO commented, that « VVC regrets Steve’s decision to leave the Board of Directors, but we understand the pressure for him to do so as he drives Proton Green to become a major player in both the helium and beverage CO 2 production. Steve, we wish you all the best and stand ready to help you in any way we can. » No replacement director has yet been appointed. The vacancy will most likely be filled in the months to come or at the next shareholders’ meeting before the end of the year.

About VVC Resources

VVC engages in the exploration, development, and management of natural resources – specializing in scarce and increasingly valuable materials needed to meet the growing, high-tech demands of industries such as manufacturing, technology, medicine, space travel, and the expanding green economy. Our portfolio includes a diverse set of multi-asset, high-growth projects, comprising: Helium & industrial gas production in western U.S.; Copper & associated metals operations in northern Mexico; and Strategic investments in carbon sequestration and other green energy technologies. VVC is a Canada-based, publicly-traded company on the TSXV (TSX-V:VVC). To learn more, visit our website at: www.vvcresources.com .

On behalf of the Board of Directors
Michel J. Lafrance, Secretary-Treasurer
For further information, please contact: For further information in French, please contact
Emily Bigelow – (615) 504-4621 Patrick Fernet – (514) 631-2727
E-mail: emily@vvcresources.com or E-mail: pfernet@vvcexploration.com

Neither TSX Venture Exchange nor its Regulation Services Provider (as that term is defined in policies of the TSX Venture Exchange) accepts responsibility for the adequacy or accuracy of this release.

2369 Kingston Road, PO Box 28059 Terry Town, Scarborough, ON M1N 4E7 Tel: 416-619-5304

News Provided by GlobeNewswire via QuoteMedia

This post appeared first on investingnews.com

Sranan Gold Corp. (CSE: SRAN) (FSE: P84) (Tradegate: P84) (‘Sranan’ or the ‘Company’) announces that CEO Oscar Louzada will be participating in the following investor conferences:

Capital Event Muskoka
Date: September 26-28, 2025
Venue: JW Marriott Rosseau Muskoka Resort, Minett, Ontario
Format: One-on-one meetings with investors
Registration: https://cem.ca/conference/muskoka-capital-event-2025/

Munich Mining Conference
Date: October 3-4, 2025
Venue: Olympic Hall, Munich
Presentation: On October 3, 2025, at 15:35-15:50, Mr. Louzada will be presenting about the Company’s recent and future planned activities at the Tapanahony Gold Project in Suriname
Booth: Investors are also invited to meet with Mr. Louzada at Sranan’s booth #70 to discuss the Company’s developments in greater detail
Free investor registration: munich-mining-conference.com

About Sranan Gold

Sranan Gold Corp. is engaged in the business of mineral exploration and the acquisition of mineral property assets in Suriname. The highly prospective Tapanahony Project is located in the heart of Suriname’s modern-day gold rush. Tapanahony covers 29,000 hectares in one of the oldest and largest small-scale mining areas of Suriname.

Sranan Gold also owns the Aida Property consisting of five mineral claims within the Kamloops Mining Division in British Columbia, Canada.

For more information, visit sranangold.com.

Information contact
Oscar Louzada, CEO
+31 6 25438975

THE CANADIAN SECURITIES EXCHANGE HAS NOT APPROVED NOR DISAPPROVED THE CONTENT OF THIS PRESS RELEASE.

Forward-looking statements

Certain statements in this release constitute ‘forward-looking statements’ or ‘forward-looking information’ within the meaning of applicable securities laws including, without limitation, the timing, nature, scope and details regarding the Company’s plans and results. Such statements and information involve known and unknown risks, uncertainties and other factors that may cause the actual results, performance or achievements of the Company, its projects, or industry results, to be materially different from any future results, performance or achievements expressed or implied by such forward-looking statements or information. Such statements can be identified by the use of words such as ‘may’, ‘would’, ‘could’, ‘will’, ‘intend’, ‘expect’, ‘believe’, ‘plan’, ‘anticipate’, ‘estimate’, ‘scheduled’, ‘forecast’, ‘predict’ and other similar terminology, or state that certain actions, events or results ‘may’, ‘could’, ‘would’, ‘might’ or ‘will’ be taken, occur or be achieved. These statements reflect the Company’s current expectations regarding future events, performance and results and speak only as of the date of this release. Further details about the risks applicable to the Company are contained in the Company’s public filings available on SEDAR+ (www.sedarplus.ca), under the Company’s profile.

To view the source version of this press release, please visit https://www.newsfilecorp.com/release/266307

News Provided by Newsfile via QuoteMedia

This post appeared first on investingnews.com

NOT FOR DISTRIBUTION TO UNITED STATES NEWSWIRE SERVICES OR FOR RELEASE PUBLICATION, DISTRIBUTION OR DISSEMINATION DIRECTLY, OR INDIRECTLY, IN WHOLE OR IN PART, IN OR INTO THE UNITED STATES.

Kobo Resources Inc. (‘ Kobo ‘ or the ‘ Company ‘) ( TSX.V: KRI ) is pleased to announce that it has closed the second tranche of its previously announced and upsized non-brokered private placement of units (the ‘ Units ‘) for gross proceeds of $1,444,875 (the ‘ Offering ‘). Under the second tranche of the Offering, 4,816,250 Units were issued at a price of $0.30 per Unit. Together with the first tranche of the Offering, for which closing occurred on September 10, the Company raised aggregate gross proceeds of $3,961,354.80 under the Offering.

Edward Gosselin, CEO and Director of Kobo commented: ‘Again, we are extremely pleased with the overall interest of investors which have subscribed to our upsized non-brokered financing and the confidence placed in Kobo’s exploration and project development strategy. Furthermore, LUSO Global Mining has participated in this second tranche of financing as well to maintain its 9.9% interest in the Company.’

3L Capital and Integrity Capital Group (together, the ‘ Advisors ‘) acted as financial advisors in connection with the Offering.

Each Unit consists of one common share of the Company (a ‘ Common Share ‘) and one-half of one common share purchase warrant (each whole common share purchase warrant, a ‘ Warrant ‘). Each Warrant entitles its holder to acquire one Common Share at a price of $0.55 per share until September 10, 2027.

The Company intends to use the net proceeds of the Offering to pursue its exploration initiatives initiated in H1-2025 and extend the known zones of mineralisation at its three main targets, the Road Cut Zone, Jagger Zone and Kadie Zone on the Kossou Gold Project, initiate preliminary metallurgical work and further develop its ongoing soil geochemical and trenching survey at Kossou as well as to enhance the geological exploration program on the Kotobi research permit and for general corporate and working capital purposes.

The Units were issued pursuant to the ‘accredited investor’ exemption from the prospectus requirements in accordance with National Instrument 45-106 – Prospectus Exemptions . The securities issued under the first tranche of the Offering are subject to a statutory hold period until January 13, 2026 in accordance with applicable Canadian securities laws.

The Company compensated certain finders by paying cash commissions equal to an aggregate amount of $15,120 and by issuing 50,400 broker warrants (the ‘ Broker Warrants ‘). In addition, the Company paid advisory fees to the Advisors in an aggregate amount of $45,000 and issued 150,000 advisor warrants (together with the Broker Warrants, the ‘ Compensation Warrants ‘). Each Compensation Warrant is exercisable until September 10, 2027, at an exercise price of $0.30 per share.

The Units and underlying Common Shares and Warrants have not been registered under the United States Securities Act of 1933, as amended (the ‘ U.S. Securities Act ‘), or any U.S. state securities laws, and may not be offered or sold to, or for the account or benefit of, persons in the ‘United States’ or ‘U.S. persons’ (as such terms are defined in Regulation S under the U.S. Securities Act) absent registration under the U.S. Securities Act and all applicable U.S. state securities laws or compliance with an exemption from such registration requirements. This press release is not an offer to sell or the solicitation of an offer to buy the securities in any jurisdiction in which such offer, solicitation or sale would be unlawful prior to qualification or registration under the securities laws of such jurisdiction.

About Kobo Resources Inc.

Kobo Resources is a growth-focused gold exploration company with a compelling new gold discovery in Côte d’Ivoire, one of West Africa’s most prolific and developing gold districts, hosting several multi-million-ounce gold mines. The Company’s 100%-owned Kossou Gold Project is located approximately 20 km northwest of the capital city of Yamoussoukro and is directly adjacent to one of the region’s largest gold mines with established processing facilities.

With over 18,500 metres of diamond drilling, nearly 5,900 metres of reverse circulation (RC) drilling, and 5,900 metres of trenching completed since 2023, Kobo has made significant progress in defining the scale and prospectivity of its Kossou’s Gold Project . Exploration has focused on multiple high-priority targets within a 9+ km strike length of highly prospective gold-in-soil geochemical anomalies, with drilling confirming extensive mineralisation at the Jagger, Road Cut, and Kadie Zones. The latest phase of drilling has further refined structural controls on gold mineralisation, setting the stage for the next phase of systematic exploration and resource development.

Beyond Kossou , the Company is advancing exploration at its Kotobi Permit and is actively expanding its land position in Côte d’Ivoire with prospective ground, aligning with its strategic vision for long-term growth in-country. Kobo remains committed to identifying and developing new opportunities to enhance its exploration portfolio within highly prospective gold regions of West Africa. Kobo offers investors the exciting combination of high-quality gold prospects led by an experienced leadership team with in-country experience.

Kobo’s common shares trade on the TSX Venture Exchange under the symbol ‘KRI’. For more information, please visit www.koboresources.com .

NEITHER THE TSXV NOR ITS REGULATION SERVICES PROVIDER (AS THAT TERM IS DEFINED IN THE POLICIES OF THE TSXV) ACCEPTS RESPONSIBILITY FOR THE ADEQUACY OR ACCURACY OF THIS RELEASE.

Cautionary Statement on Forward-looking Information:

This news release contains ‘forward-looking information’ and ‘forward-looking statements’ (collectively, ‘forward-looking statements’) within the meaning of the applicable Canadian securities legislation. All statements, other than statements of historical fact, are forward-looking statements and are based on expectations, estimates and projections as at the date of this news release. Any statement that involves discussions with respect to predictions, expectations, beliefs, plans, projections, objectives, assumptions, future events or performance (often but not always using phrases such as ‘expects’, or ‘does not expect’, ‘is expected’, ‘anticipates’ or ‘does not anticipate’, ‘plans’, ‘budget’, ‘scheduled’, ‘forecasts’, ‘estimates’, ‘believes’ or ‘intends’ or variations of such words and phrases or stating that certain actions, events or results ‘may’ or ‘could’, ‘would’, ‘might’ or ‘will’ be taken to occur or be achieved) are not statements of historical fact and may be forward-looking statements, including statements related to the exploration program of the Company. Forward-looking statements are necessarily based upon a number of estimates and assumptions that, while considered reasonable, are subject to known and unknown risks, uncertainties, and other factors which may cause the actual results and future events to differ materially from those expressed or implied by such forward-looking statements. Such factors include, but are not limited to: general business, economic, competitive, political and social uncertainties; and the delay or failure to receive requisite approvals. There can be no assurance that such statements will prove to be accurate, as actual results and future events could differ materially from those anticipated in such statements. Accordingly, readers should not place undue reliance on the forward-looking statements and information contained in this news release. Except as required by law, the Company assumes no obligation to update the forward-looking statements.

View source version on businesswire.com: https://www.businesswire.com/news/home/20250915323160/en/

For further information, please contact:
Edward Gosselin
Chief Executive Officer and Director
1-418-609-3587
ir@kobores.com

News Provided by Business Wire via QuoteMedia

This post appeared first on investingnews.com

Gold Price Surge Hits $3,385 Amid Trade Tensions

The gold price surge continued on April 21, 2025, as gold hit a record high of $3,385 per ounce. This milestone came amid a weakening U.S. dollar and renewed global trade tensions. Investors are increasingly turning to gold as a safe-haven asset, signaling market uncertainty and shifting investment strategies.

Gold Price Increase Driven by Dollar Weakness

The U.S. dollar index fell sharply, hitting its lowest level since January 2024. A weaker dollar typically boosts gold prices, as it makes the metal more attractive to international buyers. This contributed significantly to the ongoing gold price surge seen in recent weeks.

In addition, economic data indicating slower growth in key global markets has prompted investors to reduce their exposure to riskier assets. Gold’s long-standing reputation as a hedge against economic uncertainty has once again proven true.

Trade Tensions Fuel Demand for Safe-Haven Assets

Ongoing trade friction between major economies—particularly the U.S. and China—has triggered market anxiety. Announcements related to new tariffs and supply chain risks are further motivating the shift from equities to gold. This environment is ideal for a gold price surge to gain momentum.

Analysts Predict Continued Gold Price Growth

Market analysts suggest that the upward trend is far from over. If inflation persists and interest rates remain steady or fall, the gold price could climb even higher. Some predict that the next psychological barrier of $3,500 per ounce may soon be tested.

As the global economic landscape continues to evolve, gold is expected to remain a central pillar in investor portfolios. Whether as a hedge against inflation or a response to geopolitical unrest, the gold price surge is being closely monitored by financial experts.

Source: Yahoo Finance

Related: Market Insights | Commodity News

The post Gold Price Surge Hits $3,385 Amid Trade Tensions appeared first on FinanceBrokerage.